Detecting runs of homozygosity (RoH)
The BCFtools/RoH command detects regions of autozygosity in sequencing data, including exome data, using a hidden Markov model.
Preparing input data
The roh command takes on input VCF with FORMAT columns containing either
genotype likelihoods (PL) or genotypes (GT). By default, genotype likelihoods
are expected unless the -G option is provided.
The second required information is the estimate of the alternate allele
frequencies in the population for each site. There are two ways to obtain this
information. One is to supply a VCF with many samples from the same population
(preferably >100, though often it works down to just 20 individuals or
so). This allows the frequencies to be estimated from the samples provided.
Otherwise, the allele frequency information for your specific population can be
provided from other datasets: from a custom VCF annotation (--AF-tag),
from a tab-delimited file (--AF-file) or a fixed default can be used
if none of the previous is available (--AF-dflt).
Finally, a genetic map can be provided (--genetic-map) so that the model
can account for recombination hotspots. If not available, a constant
recombination rate per-base can be given (--rec-rate).
Note that also both options can be given. In that case, the --rec-rate parameter
will be interpreted differently by the program - as a fold increase of transition probabilities. This
allows the model to become more sensitive yet still account for recombination hotspots.
Of course, also the range of the values given to --rec-rate must be different in both cases:
it will be typically in the range (1e-9,1e-3) without the --genetic-map option
and in the range (10,1000) with --genetic-map. In both cases bigger values result in more sensitive calls.
The program considers only biallelic sites, sites with non-zero AF, and sites with non-missing PL/GT.
Example 1
In this example, the FORMAT/PL annotation is not present, therefore we must use FORMAT/GT, see the -G option. Also, the VCF does not contain allele frequency information and there is just one sample so it cannot be estimated on the fly. Hence we use a default AF value 0.4.
bcftools roh -G30 --AF-dflt 0.4 file.vcf -o out.txt
roh-viz -i out.txt -v test.vcf.gz -o rmme.html
Please check this usage example for details and some test data to experiment with.
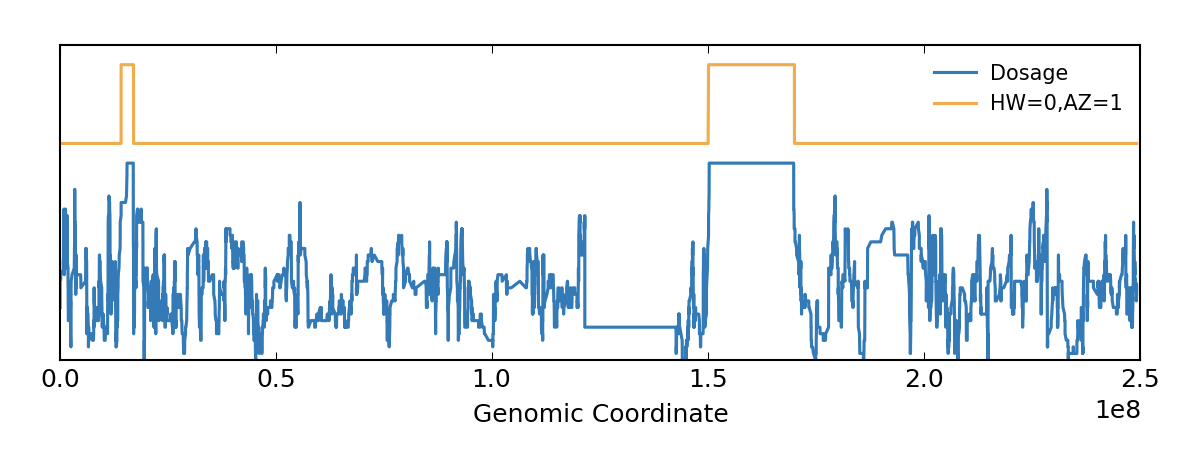
In this figure, the blue line shows heterozygosity plotted as dosage and the RoH estimate by bcftools/roh.
Example 2
In the second example we use the allele frequencies from the 1000 Genomes Project and the genetic map distributed with Impute2 (1000GP_Phase3.tgz). Because these files are big and require some (although easy) pre-processing, a packaged version can be downloaded from here: allele frequencies and genetic map.
# Annotate VCF with the AFs and run ROH
bcftools annotate -c CHROM,POS,REF,ALT,AF1KG -h AFs.tab.gz.hdr -a AFs.tab.gz in.bcf | \
   bcftools roh --AF-tag AF1KG -M 100 -m genetic-map/genetic_map_chr{CHROM}_combined_b37.txt -o roh.txt
In case a different version is needed, the following commands show how the pre-packaged genetic map and allele frequencies were created:
# Get the genetic map
curl -O https://mathgen.stats.ox.ac.uk/impute/1000GP_Phase3.tgz
tar --wildcards -xzf 1000GP_Phase3.tgz 1000GP_Phase3/genetic_map_chr\*
mv 1000GP_Phase3 genetic-map
rm -f 1000GP_Phase3.tgz

# Get alleles frequencies from the 1000 Genomes Project
curl -Lo AFs.vcf.gz https://ftp.1000genomes.ebi.ac.uk/vol1/ftp/release/20130502/ALL.wgs.phase3_shapeit2_mvncall_integrated_v5c.20130502.sites.vcf.gz
bcftools query -f'%CHROM\t%POS\t%REF,%ALT\t%AF\n' AFs.vcf.gz | bgzip -c > AFs.tab.gz
tabix -s1 -b2 -e2 AFs.tab.gz
echo '##INFO=<ID=AF1KG,Number=1,Type=Float,Description="Allele Frequency">' > AFs.tab.gz.hdr
rm -f AFs.vcf.gz
Example 3
Sometimes multiple samples need to be analyzed and compared. There is the convenience script run-roh.pl which takes multiple VCF/BCF files and locates regions private to one sample or shared across multiple samples. On input it expects a directory with .vcf, .vcf.gz or .bcf files, a file with allele frequencies and a genetic map (optional). The calls can be then plotted or visualized interactively using the plot-roh.py script
run-roh.pl -i input-dir -o output-dir
plot-roh.py -i output-dir
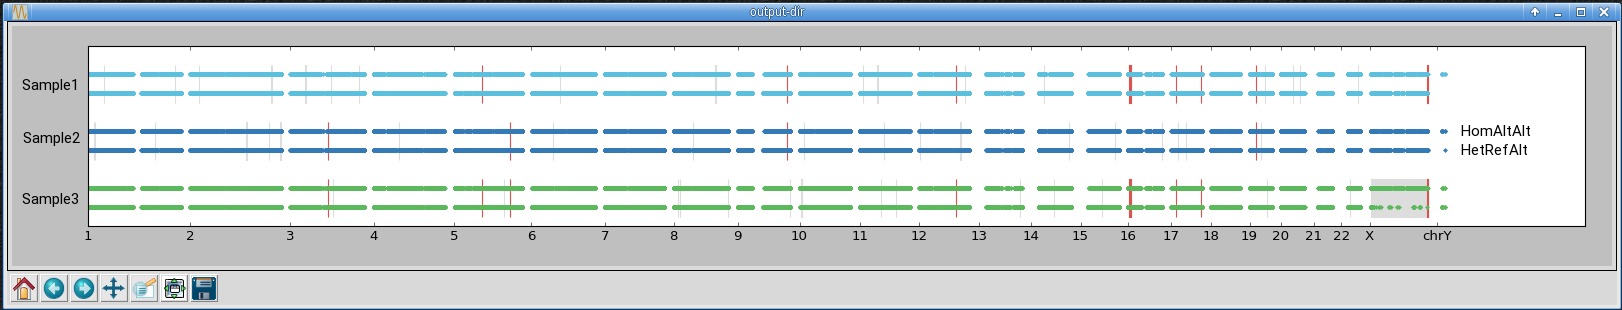
An example of the output is shown below. In the first window, all chromosomes from three samples
are shown. Each dot corresponds to one marker with either the alternate homozygous genotype (top) or the
heterozygous genotype (bottom). The grey and red rectangles highlight regions predicted by bcftools roh
as homozygous - they should contain few heterozygous genotypes. The grey rectangles highlight homozygous
regions private to one sample, while the red rectangles show homozygous regions shared across multiple samples.
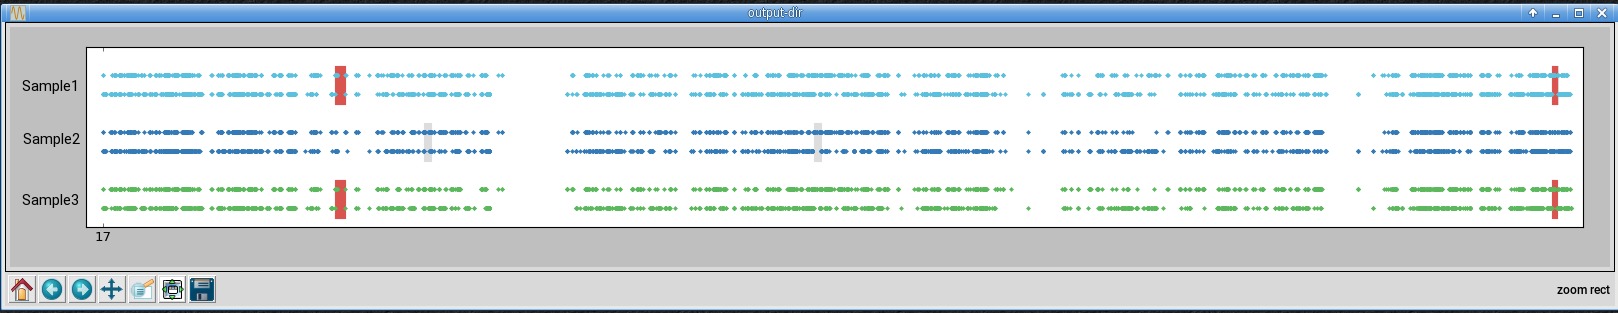
In the second window is chromosome 17, zoomed-in using the button with the magnifying glass icon.
Troubleshooting
If the results look unexpected, check how many sites have been ignored by the program. For example in this run many sites were filtered:
Number of lines: total/processed: 599218/37730
If the number of the processed sites is too low, check what was the reason for excluding them. This command should give the number of sites that were processed:
bcftools view -i'type="SNP" && AF>0' -m2 -M2 -s Indiv1 -Ou file.vcf | bcftools +counts -i'GT!="./." && GT!="."
References
Please cite this paper if you find our software useful: http://www.ncbi.nlm.nih.gov/pubmed/26826718
Feedback
We welcome your feedback, please help us improve this page by either opening an issue on github or editing it directly and sending a pull request.